
Back in March, Pew Research said that “the U.S. electorate this year will be the country’s most racially and ethnically diverse ever,” and created the following chart to estimate the demographic makeup of the 2016 presidential electorate.
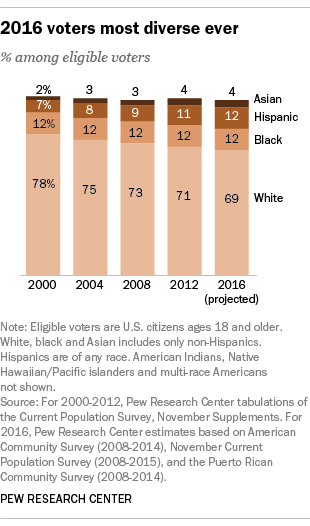
Now, that chart estimates the “eligible voters,” which is different from the “actual voters,” but compare the Pew chart to the following screenshot from the internals of the latest ABC News/Washington Post tracking poll. This shows the “voter preference by demographics of likely voters,” and the overall ratings are Clinton 47% (second column), Trump 45% (third column), Johnson 3% (fourth column), and Stein 2% (fifth column).

Hopefully, it’s not too hard for you to see that that the current ABC News/Washington Post Tracking Poll has a demographic makeup that most closely resembles the eligible vote for the 2004 election. Both have a 3:1 white/non-white ratio and both have the white percentage of the vote pegged at seventy-five percent. The main difference seems to be in the percentage of Asians, which the tracking poll acknowledges will be greater this year.
To see the difference between eligible and actual voters, let’s look at one more chart from Prof. Michael McDonald’s Elections Project:
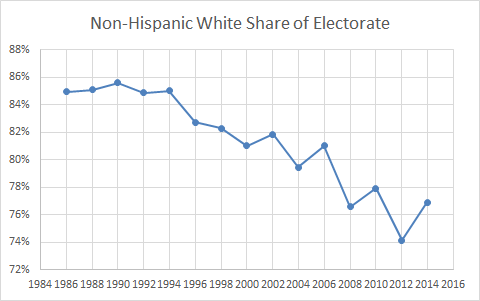
Here we can see that the actual white percentage of the vote dropped from about 80% in 2004 to 77% in 2008 to 74% in 2012. The logical inference is that it will drop to about 71% in 2016, assuming that the rate of demographic diversification hasn’t declined or accelerated and that other factors remain steady.
Another way of looking at this is to see how much the actual white vote exceeded the eligible white vote as a percentage in the last three elections. In 2004, the white eligible vote was only 75% but its actual vote was about 80%, or plus 5. In 2008, the numbers were 73% and 77%, or plus 4. In 2012, the numbers were 71% and 74%, or plus 3. This year that eligible vote is about 69%, and we don’t know what the actual will be. I just doubt that it will suddenly be plus 6.
This is just one example of how polls can differ because of different assumptions. We don’t know how different demographic groups will turn out relative to each other and in comparison to previous elections, so everyone has to make some informed guesses. Pollsters ask questions to try to gauge differential voter enthusiasm. It could be that Trump’s voters are more motivated to vote than Hillary’s, and that could help him somewhat compensate for other trend lines. But, looking at those charts do you really think it’s likely that the white percentage of the vote will fail to decline? Based on the pattern since 2000, we should expect a two to three percentage decline in the white vote.
I honestly detest the whole genre of “skewed polls” analysis where people go into denial about polls they don’t like and find reasons to explain them away. But I’m not positing anything outlandish here. I’m not telling you that blacks will stay home or that Latinos will vote in unprecedented numbers. I’m just looking at a trend line. And the trend line tells me that it’s an unreasonable supposition that the electorate will be 75% white.
Polling is one part collection and one part analysis. The most important variable is your turnout model. If your turnout model doesn’t make any sense, then it’s hard to see how your poll could be correct unless it’s just a happy accident.
But we can stipulate if we want that the ABC News/Washington Post Tracking Poll at least got the collection part of this right, which means that Trump is trailing Clinton by two points if we’re living in 2012.


Let’s assume that the actual white vote this year will be Pew’s 69% eligible plus 2% actual-bonus (continuing the trend from 5->4->3).
That’s 71% actual white vote compared to 75% whites polled by ABC/WP.
How much potential error does that 4% difference introduce, compared to the poll’s inherent margin of error? (Or is it incorporated into the MoE already?)
.04*.65=.026
2.6%
Which would make it a 4 point race rather than ABC/WP’s 2.
4 points seems to be the consensus.
Good questions. Too bad I’m lousy at math. I am just hoping for a win at this point.
After 2012 I took the exit poll margins and then looked to see if Obama would have won with prior racial electorate makeups.
If Obama had the same margin within racial groups in 2004, but with 2004 white share of the electorate, he would have lost by 2. Go further back and he loses by 8.
I just can’t believe we will lose given this. I get the state polling is close. NH looks like it might be gone. But Clinton has to be able to win one of Florida, NC or CO given the changing electorate.
But maybe instead we find out that the choice of Kaine was made in denial: Democrats need a POC on the ticket.
Not to worry …
http://www.dailykos.com/stories/2016/11/2/1590420/-More-Evidence-That-Hillary-Is-Up-Big-in-Florida?_
=2016-11-02T20:26:13.994-07:00
I exchange email with the guy that did targeting in ’08.
Let’s say he would find that absurdly optimist.
Florida is close, and it is going to be close, and it always is close.
At this point, I am attempting to completely tune out virtually every pundit and prognosticator that comes across my computer or tv screen. They are a danger to my sanity and peace of mind. They seem to me to be almost a danger to democracy at this point, with their asinine and shallow points of view and opinions.
A last full weekend of GOTV, then all I can do is wait. As always at this point, I am nervous as hell. More this time than I have ever been. The stakes are higher than they have been in my entire adult life.
Ditto. I’m a wreck.
GOTV really does help your peace of mind. Did for me, at least.
Helps that my GOTV was largely getting elderly Democrats to make Tuesday plans.
my strategy is reading Joel Dan’s diary over and over and over. more calming than reading about the election.
There’s some dispute about exactly what the demographic makeup of past elections was in the first place:
The exit polling would indicate a slightly different electorate in 2012 than the Pew Polling indicates as well:
According to the Exit Polling 2012: 72% white, 13% black, 10% Latino, 3% Asian, 2% other (mixed race). They broke: whites Romney 59%-39%; blacks Obama 93%-6%; Asians 73%-26% Obama, mixed race/other: Obama 58%-38%.
That means that non-whites overall, 28% of the electorate, voted Obama 80.3% – 17.9% Romney, according to the exit polling. So, the Pew data doesn’t account for “Other” non-whites, which by their own data had to constitute 2% of the electorate and who favored Obama, but not by nearly the 80% margin that Blacks/Asians/Latinos did.
Assuming that the White vote declines by 3% from 72% to 69% and the non-white vote increases to 31% as suggested by Pew, we reach the next qualification: will non-whites vote in the same percentages for Hillary Clinton as they did Obama? The polling data so far would indicate that Hillary is getting less than the 93% of black support Obama got, not at all surprising, but also that she’s probably winning Latinos by a significantly larger margin than Obama did. Trump is around 18%-20% in some Univision & other polling taken exclusively among Latinos to avoid sampling errors.
But, assuming (since we can’t know) that 80% of non-whites overall vote for Hillary, that increase of 3% in their percentage of the electorate would equal a boost of 2.4% for Hillary. If overall turnout was the same as in 2012 that means 2.4% of 130,000,000 voters or 3.1 million votes. Her margin over Trump (at most 80%-20%) would be (3.1 *.8) – (3.1 * .2) = 1.86 million votes.
That’s why Trump has always been the underdog in this election. Obama won by nearly 5 million votes, and then you add another 1.86 million votes or so to that total. Now Trump would have to either find 3 million plus new White voters to compensate for demographic growth, or else convince 3 million or so white voters who voted for Obama to switch to him.
Neither of those things is likely, so his only really remaining hope is that he manages to do significantly better in battleground states like Ohio, Iowa & Pennsylvania, enough to offset his losing the popular vote and letting him win in the electoral college.
There’s no way of knowing if that strategy has any realistic chance of success. Nate Silver estimates the current probability that Trump loses the popular vote, but wins the electoral college at 11.9%, considerably less than his overall chances in Nate’s model.
Basically, Trump’s only realistic chance is to hope his voters turn out, Democrats don’t turn out, AND that there’s a significant polling error favouring him.
Ok, this is getting too weird for words. And to give a current example: The Trafalgar Group.
Short story even shorter: Trump is ahead in NC because your neighbors say you are voting for Trump, even tho YOU say you are voting for not Trump.
Also, the legions of the previous voters (prior to 2006) who haven’t voted since are coming to get you.
This poll is being accepted and counted by 270 to Win.
Is it only me, or is this methodology terminally fucked?
not obviously so. (Noting, 538 includes it, too, but “adjusts” result to Trump +3.)
I clicked the link. The reported 4.96% Trump lead is from the straightforward question: “If the election were held today, for whom would you vote?”
They did ask the separate question about how do you think your neighbor will vote, in which Trump fared even better.
And they speculate that the “real” result lies between those two answers, but that’s not the “result” they report.
Also, they report Clinton does better with those voters coming out of the woodwork who haven’t voted since ’06, so that’s not some trick to bias result against her either.
I skimmed through the results and methodology, and found no glaring red flags, though of course all the usual caveats apply: regional/demographic weighting, likely voter screen (here seems to have been simply that they said they planned to vote), etc.
Ok, I’ll buy that.
polling period, has Clinton +3 (538-“adjusted” to +4).
Silver rates Trafalgar C.
Shrug
Two polls out of NH today show Trump ahead. It would be entirely understandable if whites stayed the same as 2012 because of white nationalism. Or continued to decline along the trend-line. Who knows.
The ABC tracking poll has Clinton up by 2 again. As I’ve mentioned elsewhere, I am primarily paying attention to the polling aggregators, such as Nate Silver and Sam Wang, and periodically peeking in at what an open source aggregator is finding. Basically the takeaway with regard to Clinton is don’t be complacent but don’t panic. The final Senate makeup will be a bit more of a nail biter, but the safer bet seems to be that the Dems will at least end the election with the 50 seats they need. As for demographics, I would be surprised if the White vote matched that of 2012. But again I would take nothing for granted. Hopefully the ground game for the Presidency and the down ballot races is as good as we’re being led to believe. I’ve been watching the GOP devolve into a white nationalist party for a while, and living in plenty of red areas over the years have been witness up close and personal. I don’t see a future for that party if it continues to go that route. Something will have to give sooner or later. There has always been an undercurrent of white nationalism in this country. Regardless of what direction the GOP takes, that undercurrent will remain, and given the shrinking numbers of White Protestants, I would expect that the fever among the nationalist undercurrent is very far from breaking.
Sam Wang was wrong in 2004 and 2014.
Nate is dead right about the risk here.
I think we will win – but this is close.
We certainly don’t disagree that this will be close. But then, I suspect that many of us figured it would be. Yes, Trump is truly awful, but tribal loyalties being what the are….
Because the electoral college is a total of state votes that are mostly quantized instead of proportional, I have problems nodding about this analysis that has not been done at the state level state-by-state.
Under this model, what would the expected results be for Wyoming as contrasted with California or Mississippi? Or Vermont? Would it explain, for example, why Colorado and New Hampshire are the current tipover states for victory in this election?
Could you use the 2012 data to get variances in which Obama underperformed or overperformed this demographic model? Which states are likely for Clinton to overperform or underperform the demographics in this race? From a campaign strategy standpoint, how much should margin affect tactical decisions and how much potential underperformance of the demographics?
The Clinton campaign sure looks to be shoring up North Carolina and Florida in the face of two substantial efforts by the state to suppress the Clinton vote through legislation.